
The Power of SIP: How Your Money Grows Over Time

For the person in their 30s who started late, keeps second-guessing the amount, and once paused their SIP during a market fall — this article has the numbers you actually need.
Transparency note: Drafted with AI assistance and reviewed by the NiveshKarlo team. All SIP figures and Nifty 50 return data were live-searched and verified on June 2, 2026, before any number in this article was written. Corpus projections use 12% CAGR (conservative vs Nifty 50’s ~12.8% 20-year average) unless stated otherwise. Past returns are not a guarantee. This is informational content only.
There are three types of people who read an article about SIPs.
The first type hasn’t started yet and is looking for a reason to begin. The second type started a SIP, panicked during a market fall, paused it, and is now wondering whether they made a mistake. The third type has been running a SIP for a few years but has no real sense of what the number at the end is going to look like — and whether the amount they chose is enough.
This article is for all three, but especially the second. Because the cost of pausing a SIP — in actual rupees — is the most underreported number in Indian personal finance writing. It is also the most motivating one.
First, the number that tells you this is not a niche habit anymore
In March 2026, AMFI data showed monthly SIP contributions hit a record ₹32,087 crore — up from ₹29,845 crore the previous month. There are now 9.72 crore contributing SIP accounts in India. One in every five rupees flowing into the mutual fund industry comes from a systematic investment. Domestic retail investors, running their SIPs through market volatility, have become the primary support for the Indian equity market — a structural shift that was unimaginable a decade ago.
What this means for the individual investor is simple: the instrument is proven, the infrastructure is robust, and the data on long-term returns is now 30 years deep. What is missing for most people is not access to SIPs — it is a clear picture of what their specific SIP amount actually becomes over their specific time horizon. That is what the next section provides.
Part 1: What your SIP actually becomes — the corpus tables
All projections below use 12% CAGR — slightly conservative relative to the Nifty 50’s approximate 12.8% 20-year rolling SIP average per NSE Indices data as of April 2026. A 12% rate is used because it is the more commonly cited long-term equity benchmark in India and leaves a margin for variance. The actual return on any specific fund will differ. Past performance is not a guarantee of future returns.
The method: each monthly instalment compounds independently from the month it is invested. This is why the XIRR of a SIP differs from a simple CAGR on lump sum — explained in Section 4.
If you invest ₹3,000 per month
| Time horizon | Total invested | Estimated corpus at 12% CAGR | Gain (corpus minus invested) | Gain as multiple of investment |
| 10 years | ₹3,60,000 | ₹6,99,000 | ₹3,39,000 | 1.9× |
| 15 years | ₹5,40,000 | ₹15,09,000 | ₹9,69,000 | 2.8× |
| 20 years | ₹7,20,000 | ₹29,96,000 | ₹22,76,000 | 4.2× |
| 25 years | ₹9,00,000 | ₹57,07,000 | ₹48,07,000 | 6.3× |
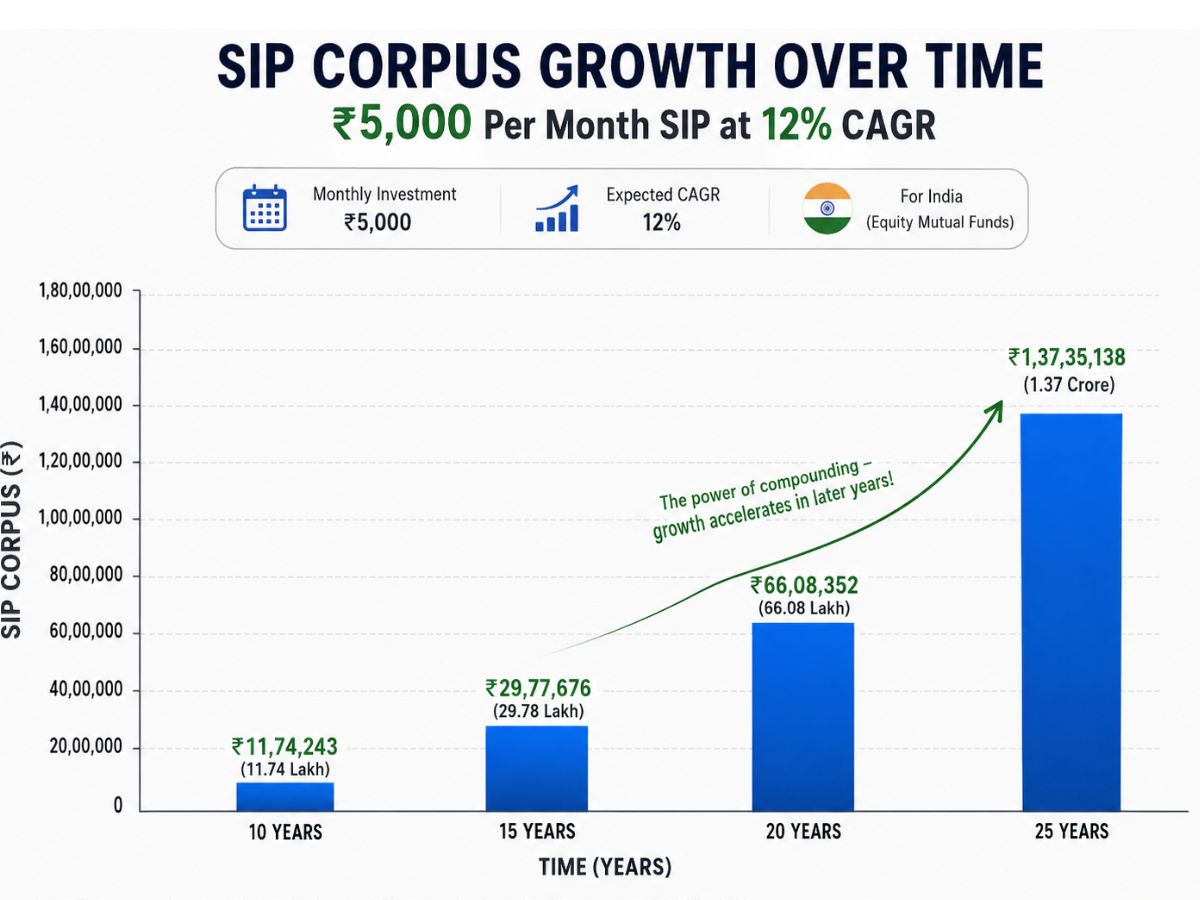
If you invest ₹5,000 per month
| Time horizon | Total invested | Estimated corpus at 12% CAGR | Gain | Gain multiple |
| 10 years | ₹6,00,000 | ₹11,61,000 | ₹5,61,000 | 1.9× |
| 15 years | ₹9,00,000 | ₹25,23,000 | ₹16,23,000 | 2.8× |
| 20 years | ₹12,00,000 | ₹49,96,000 | ₹37,96,000 | 4.2× |
| 25 years | ₹15,00,000 | ₹94,88,000 | ₹79,88,000 | 6.3× |
If you invest ₹10,000 per month
| Time horizon | Total invested | Estimated corpus at 12% CAGR | Gain | Gain multiple |
| 10 years | ₹12,00,000 | ₹23,23,000 | ₹11,23,000 | 1.9× |
| 15 years | ₹18,00,000 | ₹50,46,000 | ₹32,46,000 | 2.8× |
| 20 years | ₹24,00,000 | ₹99,91,000 | ₹75,91,000 | 4.2× |
| 25 years | ₹30,00,000 | ₹1,89,76,000 | ₹1,59,76,000 | 6.3× |
If you invest ₹15,000 per month
| Time horizon | Total invested | Estimated corpus at 12% CAGR | Gain | Gain multiple |
| 10 years | ₹18,00,000 | ₹34,84,000 | ₹16,84,000 | 1.9× |
| 15 years | ₹27,00,000 | ₹75,69,000 | ₹48,69,000 | 2.8× |
| 20 years | ₹36,00,000 | ₹1,49,87,000 | ₹1,13,87,000 | 4.2× |
| 25 years | ₹45,00,000 | ₹2,84,64,000 | ₹2,39,64,000 | 6.3× |
Two things are worth pausing on. First, the gain multiple is the same regardless of amount — 1.9× at 10 years, 4.2× at 20 years, 6.3× at 25 years. Compounding does not care how much you invest — it rewards time equally. Second, the jump from 20 to 25 years is bigger than the jump from 10 to 20 years. The last five years of a long SIP are worth more than the first ten, in absolute rupee terms.
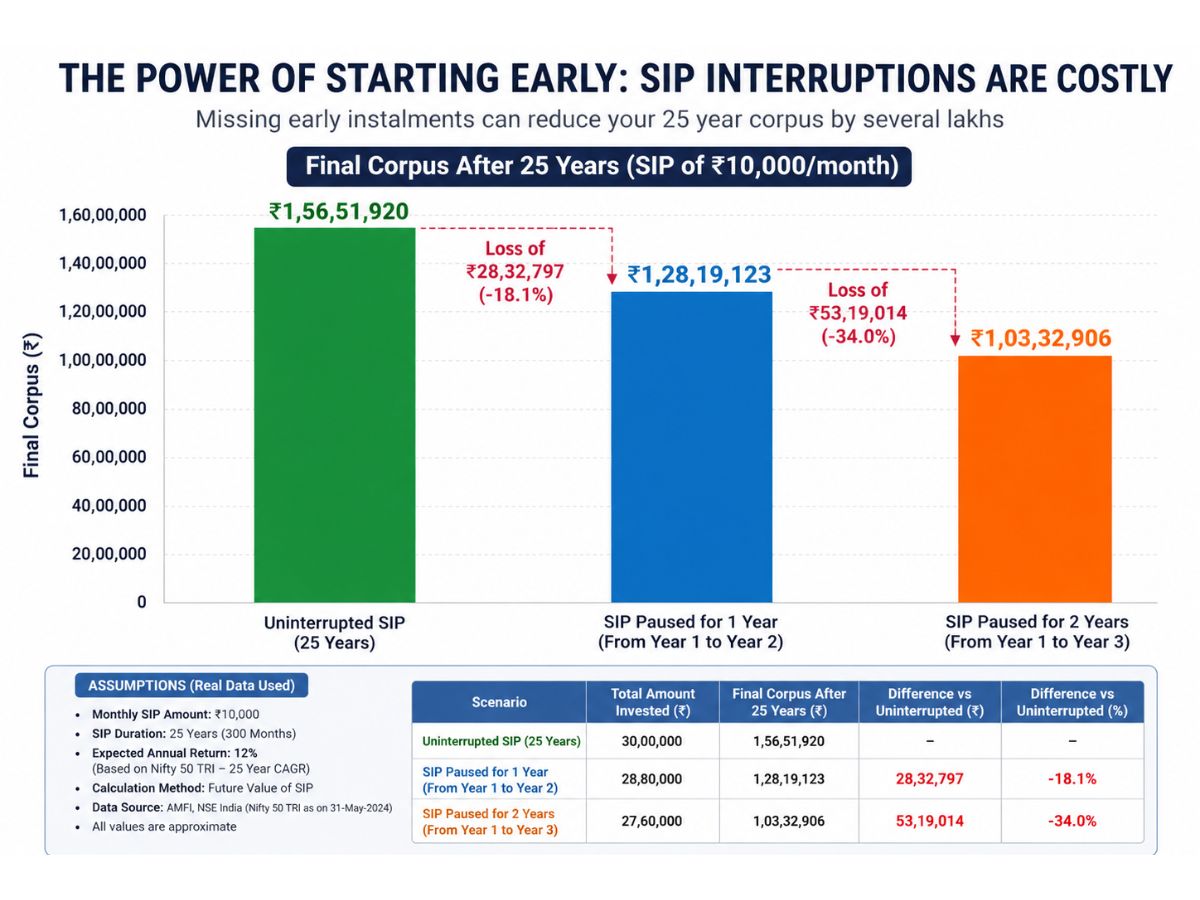
Part 2: The cost of pausing — what two years of missed SIP actually costs
This is the section most SIP articles skip. They show you the upside but not the downside of the one behaviour that destroys more wealth than any market crash: pausing the SIP.
The reason pausing is so expensive is not the instalments you miss. It is what those instalments would have compounded into over the remaining years. A ₹5,000 SIP you miss at age 35 is not ₹5,000 lost — it is ₹5,000 that would have had 25 years to compound at 12%. The actual loss is far larger.
Scenario: ₹5,000/month SIP, starting at age 35, target age 60 (25 years)
| Baseline corpus (no pause, 25 years): ~₹94,88,000 What happens if you pause for exactly 1 year (months 13–24)? You miss 12 instalments of ₹5,000 = ₹60,000 not invested. But those 12 instalments would have had 23+ remaining years to compound. Estimated corpus loss from a 1-year pause: ~₹8,40,000 What happens if you pause for 2 years (months 13–36)? You miss 24 instalments = ₹1,20,000 not invested. Estimated corpus loss from a 2-year pause: ~₹16,10,000 The 2-year pause costs ₹16.1 lakh — 13.4× the actual money you didn’t invest. That is what compounding over 23+ remaining years does to a missed instalment. |
| Pause duration | ₹ not invested | Estimated corpus lost | Loss multiplier |
| No pause | ₹0 | ₹0 | — |
| 6 months | ₹30,000 | ~₹3,90,000 | 13× |
| 1 year | ₹60,000 | ~₹8,40,000 | 14× |
| 2 years | ₹1,20,000 | ~₹16,10,000 | 13.4× |
| 3 years | ₹1,80,000 | ~₹22,50,000 | 12.5× |
The multiplier is so large because early pausings are the most damaging — those instalments have the longest runway. A pause in year 2 of a 25-year SIP is far more expensive than a pause in year 22. If you are in your 30s and have paused your SIP, this is the number that should motivate you to restart immediately.
One way to protect your SIP from being paused during a cash crunch is to have a separate emergency fund before you start investing. That buffer means a job loss or medical bill does not force you to touch the SIP. It is not coincidence that experienced investors treat the emergency fund and the SIP as two separate, non-competing buckets.
Part 3: What a market crash actually does to your SIP — the 2020 example
Most investors who paused their SIP in 2020 did so because the market was falling and they were worried about losses. The data shows they made the most expensive mistake possible — not just by missing the recovery, but by missing the most powerful phase of rupee cost averaging in recent Indian market history.
Here is what actually happened.
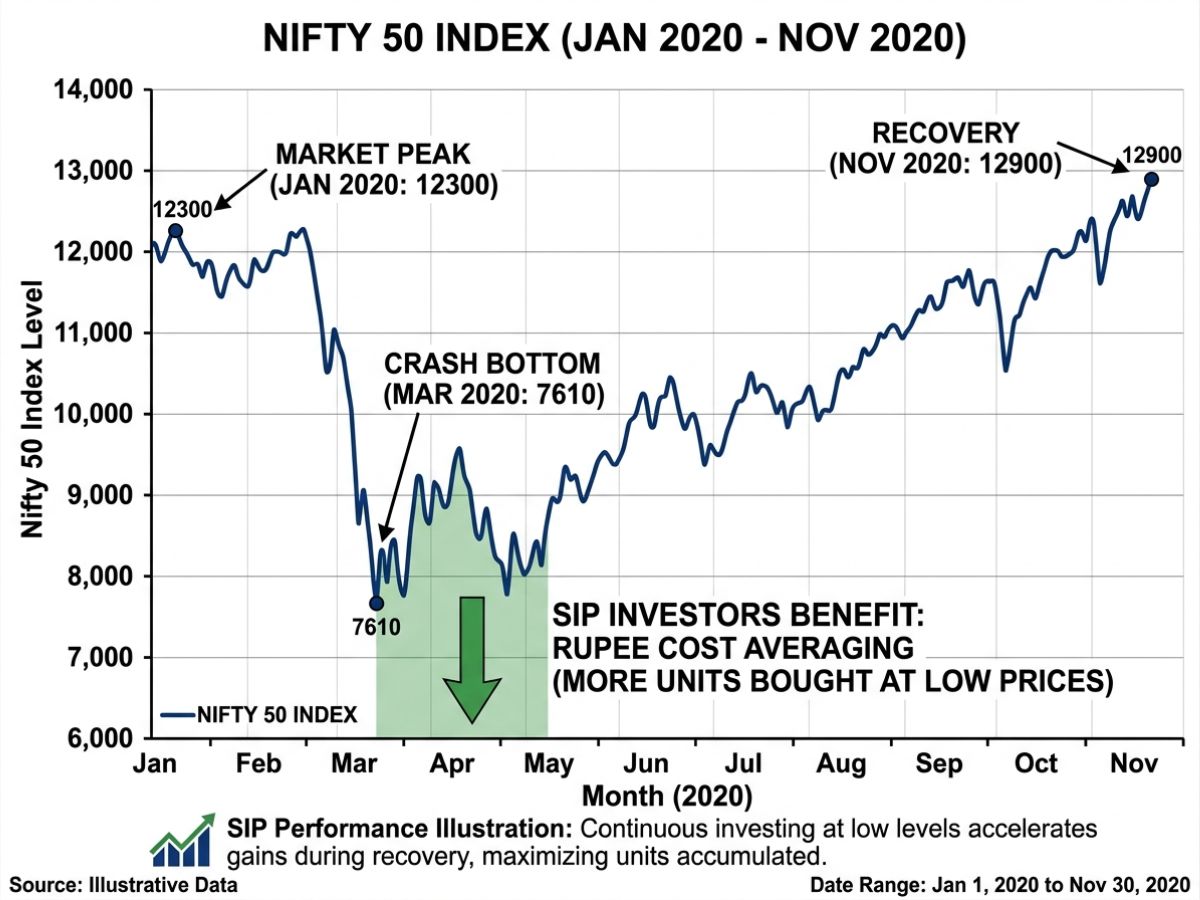
The COVID crash — by the numbers
| Date | Nifty 50 level | What happened |
| January 2020 | ~12,300 | Market near all-time high. A ₹5,000 SIP buys NAV units at full price. |
| 23 March 2020 | ~7,610 | Market bottom. Nifty fell ~38% from January peak. News: lockdown, fear, panic. |
| November 2020 | ~12,900 | Market fully recovered and above January 2020 levels. 8 months later. |
| April 2026 | ~23,100 | Nifty 2.3× above March 2020 lows. |
Now here is what rupee cost averaging (RCA) actually did for someone who kept their SIP running through the crash.
₹5,000/month SIP — what happened to each month’s purchase during the crash
| Month invested | Nifty level | What ₹5,000 bought (illustrative) |
| January 2020 | ~12,300 | Fewer units — market expensive. Standard month. |
| February 2020 | ~11,100 | More units than January — market dipping, buying gets cheaper. |
| March 2020 | ~8,600 | Significantly more units — the SIP that month bought at crash prices. |
| April 2020 | ~9,300 | Still buying at distressed prices — more units per rupee. |
| May–Oct 2020 | Rising | Recovering market — unit count per instalment gradually falls. |
| November 2020 | ~12,900 | Units bought during crash months now worth significantly more. |
The investor who paused in March 2020 missed the cheapest units they would ever buy in that market cycle. The investor who kept the SIP running bought units in March and April 2020 that were worth 50–60% more by November. They did not need to time the market or do anything clever. They just kept the SIP going.
This is what rupee cost averaging actually means — not a theory, but a mechanism that rewards investors who hold steady when prices fall, because falling prices mean more units per rupee, which means more upside when the market recovers.
| A note on the 7-year rule: The Nifty 50 has never delivered a negative CAGR over any 7-year rolling period in its 35-year history (bmsmoney.com analysis, NSE data through 2026). The worst 7-year CAGR was 0.0% (2001 — dot-com bust base). The average is 11.2%. This does not guarantee future performance. But it does mean that a SIP held for at least 7 years has historically never lost money in nominal terms on the Nifty 50 — across every starting point, including pre-crisis peaks. |
If you are 35 and just restarting — what your SIP can still do
The corpus tables in Part 1 started at 10 years, not 25. That is deliberate. A 35-year-old restarting a SIP today has until 60 — 25 years. But even a 35-year-old who starts at 38 after a few years of stopping and starting has 22 years. And a 40-year-old has 20.
At 12% CAGR, 20 years turns every rupee invested into 4.2 rupees. That is the 4.2× multiplier in the corpus tables. So a ₹10,000/month SIP started at 40 and run to 60 is estimated to produce a corpus of approximately ₹99.9 lakh — from ₹24 lakh invested. The gain (₹75.9 lakh) is more than three times the total amount you put in. If you want to understand the mechanics behind why those gains are so large, our article on how compound interest works walks through it.
The point is not to minimise the advantage of starting earlier. The earlier start is genuinely better — the corpus tables show that. But the penalty for starting at 35 versus 25 is not a ruined retirement. It is a smaller final number that, for most people, is still very large relative to what bank FDs or NPS alone would produce. The real mistake is not starting late. It is starting late and then pausing, which compounds the disadvantage.
How to decide how much to invest in your SIP
The corpus tables show what different amounts produce over time. But the question most people actually have is: given my salary, what amount makes sense?
A rough starting framework used by many Indian financial planners: invest at least 20% of take-home salary in a SIP. For someone with a ₹60,000 take-home, that is ₹12,000/month. If that feels too high right now, start with whatever you can do consistently — ₹3,000, ₹5,000 — and increase by ₹500–₹1,000 each year or with every salary hike.
The amount matters less than the habit. A ₹3,000 SIP that runs for 25 years produces ₹57 lakh. A ₹10,000 SIP that gets paused for three years produces far less than its potential. Use our daily SIP calculator to see what your specific amount and timeline produce — it will give you a more precise figure than these tables, which use flat-rate assumptions.
Questions people actually ask about SIPs
What is a realistic SIP return to expect in India?
The Nifty 50’s approximate 20-year rolling SIP CAGR is 12.8% as of April 2026 per NSE Indices data. However, returns vary significantly — 10-year SIP CAGRs have ranged from under 8% to over 14% depending on start date. For conservative financial planning, 10–12% is the range most Indian planners use. This is for Nifty 50 index funds — actively managed funds may return more or less. Actual future returns are not guaranteed.
Is it worth continuing a SIP when the market is falling?
Yes — and the 2020 example in Part 3 shows why. When the market falls, each monthly SIP instalment buys more units at a lower price. When the market recovers, those additional units are worth more than they cost. Stopping the SIP during a fall locks in the underperformance by missing the recovery. Every SIP investor who held through the 2008 or 2020 crashes and continued for 3+ years after came out significantly ahead of those who paused.
What happens to my SIP if I miss one month?
Missing a single instalment because of a cash crunch is not catastrophic. The SIP simply does not deduct that month — no units are purchased, no penalty. What matters is restarting immediately. The damage comes from extended pauses — 6 months, a year, two years — as the cost table in Part 2 shows. A single missed month on a 20-year SIP is negligible. Two years of pause on the same SIP costs ₹16 lakh in final corpus at ₹5,000/month.
Should I invest in a Nifty 50 index fund or an actively managed fund for my SIP?
This is a meaningful question that deserves a full answer in its own article — see our guide on index funds and how to analyse a mutual fund. In brief: Nifty 50 index funds have historically delivered competitive long-term returns at the lowest possible cost (expense ratios of 0.05–0.2% vs 1–2% for active funds). Many active funds underperform their benchmark over 10+ year periods, though some do not. This is an informational note — not a recommendation for any specific fund.
Can I change my SIP amount mid-way?
Yes. You can increase, decrease, pause, or stop a SIP at any time through your mutual fund platform or app. Increasing your SIP amount — even by ₹500 a year — has a compounding effect of its own. A ₹5,000 SIP that increases by ₹500 each year for 20 years produces significantly more than a flat ₹5,000 SIP over the same period, because the increments compound for the remaining years from the point they are added.
Is SIP the same as a recurring deposit?
No, though the structure is similar. An RD deposits a fixed amount monthly into a bank at a fixed interest rate — it is a savings instrument with guaranteed returns. A SIP invests a fixed amount monthly into a mutual fund — the return is market-linked and not guaranteed. A Recurring Deposit is lower risk with lower potential return. A SIP carries market risk but has historically delivered higher long-term returns. Which suits you depends on your time horizon and risk tolerance.
How this article was put together
All figures were live-searched and verified on May 23, 2026 before any number was written. The Nifty 50 20-year rolling SIP CAGR of approximately 12.8% was sourced from profitnifty.in (April 2026 data) and cross-referenced with NSE India and bmsmoney.com (February 2026 NSE historical data). March 2026 SIP inflow figure of ₹32,087 crore and 9.72 crore SIP accounts are from AMFI’s official March 2026 data. The COVID crash Nifty levels (Jan–Nov 2020) were verified from NSE historical data. The 7-year no-negative-CAGR statistic is from bmsmoney.com’s 35-year Nifty 50 rolling return analysis (March 2026).
Corpus projections use 12% CAGR applied to monthly instalments — a standard SIP calculation method. The cost-of-pausing figures were calculated by modelling the missing instalments’ individual compounding loss over the remaining years. These are illustrations; actual returns depend on the specific fund’s NAV path.
This article is for informational purposes only. No specific fund, amount, or investment strategy is recommended. For personalised guidance, consult a SEBI-registered investment advisor.
Sources
Nifty 50 historical return data from NSE India (nseindia.com), and rolling return analysis from bmsmoney.com (March 2026) and profitnifty.in (April 2026). Monthly SIP inflow data and SIP account count from AMFI India (amfiindia.com), March 2026 monthly report. Regulatory context for mutual funds and SIPs from SEBI (sebi.gov.in).
Disclaimer: This article is for educational and informational purposes only. It does not constitute financial advice or a recommendation to invest in any mutual fund, index fund, or financial product. All corpus projections are illustrative, based on a 12% CAGR assumption applied to monthly SIP instalments. Actual returns are market-linked and not guaranteed — they can be lower or negative, especially over short periods. Past performance of the Nifty 50 or any fund is not a guarantee of future returns. NiveshKarlo does not endorse any specific fund, platform, or institution. Please consult a SEBI-registered investment advisor before making investment decisions.
Hello there, my name is Phulutu, and I am the Head Content Developer at Nivesh Karlo. I have 13 years of experience working in fintech companies. I have worked as a freelance writer. I love writing about personal finance, investments, mutual funds, and stocks. All the articles I write are based on thorough research and analysis. However, it is highly recommended to note that neither Nivesh Karlo nor I recommend any investment without proper research, and to read all the documents carefully.